top of page
Sona Index Spectrometery (SIS) Plotter
The SIS Plotter is an application designed to evaluate spectrometers in science space. SIS plotter generates scatterplot matrices that compare the specifications and characteristics of instruments from our database. These plots can be used to evaluate an instrument's applications and capabilities compared to other instruments. Blanks or empty spaces found in the plots can be interpreted as instrument configurations that do not currently exist (excluding inherently related specs), which can point towards possible new science. SIS plotter can also be used to analyze the trends in space instrument developments over time. Another application of the SIS plotter is as a metric to evaluate voids in instrument capabilities, which can prove useful in project proposal evaluations and decisions.
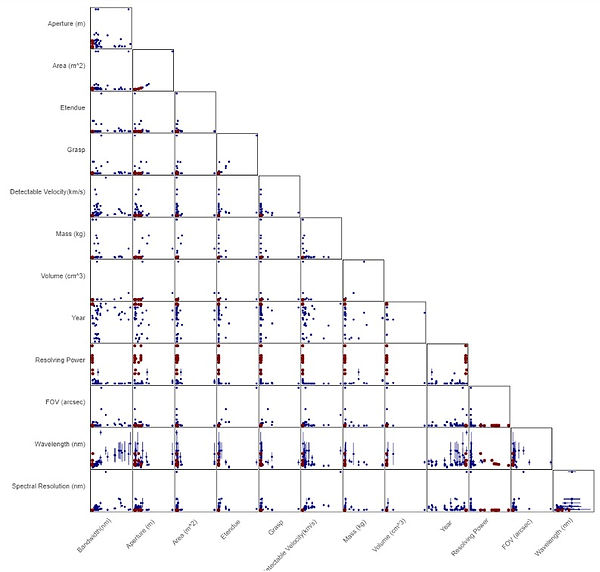
SIS plotter Example
bottom of page